Same population estimate as last year
January 1st 2018 there lived 55.877 persons in Greenland. Thus, the population increased by 17 persons during 2017 and the population count is almost unchanged.
Summary table 1. Population January 1st 2009-2018
|
|
2009 |
2010 |
2011 |
2012 |
2013 |
2014 |
2015 |
2016 |
2017 |
2018 |
|
Total |
56.193 |
56.452 |
56.615 |
56.749 |
56.370 |
56.282 |
55.983 |
55.847 |
55.860 |
55.877 |
|
Men |
29.808 |
29.936 |
29.942 |
30.041 |
29.838 |
29.730 |
29.555 |
29.543 |
29.493 |
29.489 |
|
Women |
26.385 |
26.516 |
26.673 |
26.708 |
26.532 |
26.552 |
26.428 |
26.304 |
26.367 |
26.388 |
Source: Statistics Greenland, http://bank.stat.gl/beest1
In both Kommuneqarfik Sermersooq, Qaasuitsup Kommunia and the new municipality Kommune Qeqartalik the population estimate rose in 2017. Particularly in Nuuk, where the increase amounted to 196 persons. 31.8 per cent. (17,796) of the population now lives in Nuuk.
In total the population estimates for the settlements decreased by 225 persons from 7,356 to 7,131. However, the high displacement in Avannaata Kommunia was not voluntary but caused by the natural disaster that struck the settlements Illorsuit and Nuugaatsiaq in the summer of 2017.
Figure 1. Population in settlements 1977-2017
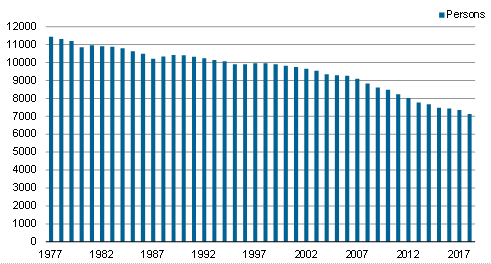
Source: Statistics Greenland, http://bank.stat.gl/beest1
Summary table 2 Population in municipalities 2018
|
|
-16 |
17-64 |
65+ |
Men |
Women |
Total 2017 |
Total 2018 |
Change from 2017 to 2018 |
|
Total |
13.130 |
38.110 |
4.637 |
29.489 |
26.388 |
55.860 |
55.877 |
17 |
|
Towns |
11.260 |
33.224 |
4.008 |
25.410 |
23.082 |
48.248 |
48.492 |
244 |
|
Settlements |
1.830 |
4.688 |
613 |
3.906 |
3.225 |
7.356 |
7.131 |
-225 |
|
Stations |
- |
88 |
2 |
75 |
15 |
94 |
90 |
-4 |
|
Farms |
40 |
93 |
13 |
84 |
62 |
141 |
146 |
5 |
|
Unknown |
- |
17 |
1 |
14 |
4 |
21 |
18 |
-3 |
|
Kommune Kujalleq |
1.481 |
4.361 |
782 |
3.503 |
3.121 |
6.692 |
6.624 |
-68 |
|
Towns |
1.291 |
3.761 |
642 |
2.969 |
2.725 |
5.725 |
5.694 |
-31 |
|
Settlements |
150 |
509 |
128 |
452 |
335 |
829 |
787 |
-42 |
|
Stations |
- |
- |
- |
- |
- |
- |
- |
- |
|
Farms |
40 |
91 |
12 |
82 |
61 |
138 |
143 |
5 |
|
Unknown |
- |
- |
- |
- |
- |
- |
- |
- |
|
Kommuneqarfik Sermersooq |
5.272 |
16.031 |
1.435 |
11.975 |
10.763 |
22.673 |
22.738 |
65 |
|
Towns |
4.935 |
15.272 |
1.316 |
11.311 |
10.212 |
21.432 |
21.523 |
91 |
|
Settlements |
337 |
752 |
118 |
657 |
550 |
1.232 |
1.207 |
-25 |
|
Stations |
- |
3 |
- |
3 |
- |
1 |
3 |
2 |
|
Farms |
- |
2 |
1 |
2 |
1 |
3 |
3 |
- |
|
Unknown |
- |
2 |
- |
2 |
- |
5 |
2 |
-3 |
|
Qeqqata Kommunia |
2.175 |
6.255 |
865 |
4.960 |
4.335 |
9.239 |
9.295 |
56 |
|
Towns |
1.883 |
5.365 |
777 |
4.260 |
3.765 |
7.975 |
8.025 |
50 |
|
Settlements |
292 |
890 |
88 |
700 |
570 |
1.264 |
1.270 |
6 |
|
Stations |
- |
- |
- |
- |
- |
- |
- |
- |
|
Farms |
- |
- |
- |
- |
- |
- |
- |
- |
|
Unknown |
- |
- |
- |
- |
- |
- |
- |
- |
|
Kommune Qeqertalik |
1.567 |
4.289 |
677 |
3.397 |
3.136 |
6.500 |
6.533 |
33 |
|
Towns |
1.322 |
3.703 |
608 |
2.901 |
2.732 |
5.628 |
5.633 |
5 |
|
Settlements |
245 |
586 |
69 |
496 |
404 |
872 |
900 |
28 |
|
Stations |
- |
- |
- |
- |
- |
- |
- |
- |
|
Farms |
- |
- |
- |
- |
- |
- |
- |
- |
|
Unknown |
- |
- |
- |
- |
- |
- |
- |
- |
|
Avannaata Kommunia |
2.635 |
7.074 |
875 |
5.570 |
5.014 |
10.647 |
10.584 |
-63 |
|
Towns |
1.829 |
5.123 |
665 |
3.969 |
3.648 |
7.488 |
7.617 |
129 |
|
Settlements |
806 |
1.951 |
210 |
1.601 |
1.366 |
3.159 |
2.967 |
-192 |
|
Stations |
- |
- |
- |
- |
- |
- |
- |
- |
|
Farms |
- |
- |
- |
- |
- |
- |
- |
- |
|
Unknown |
- |
- |
- |
- |
- |
- |
- |
- |
|
Outside Municipalities |
- |
100 |
3 |
84 |
19 |
109 |
103 |
-6 |
Source: Statistics Greenland, http://bank.stat.gl/beest2
Figure 2. Neighborhoods in Nuuk 1994 – 2018
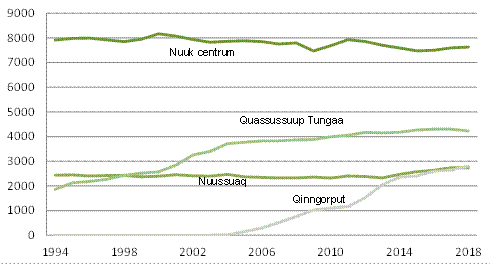
Source: Statistics Greenland, http://bank.stat.gl/beestnuk
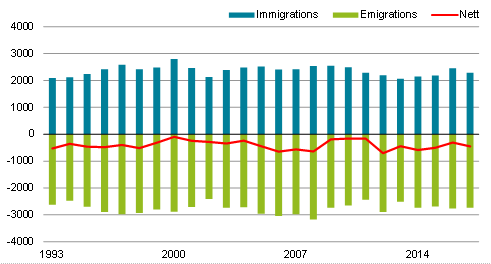
The figure below shows the development of migration in the period 1993-2017. On average, 403 more people moved from Greenland than to, each year throughout the period. In 2017 a total of 2,287 people immigrated while 2,736 people emigrated. Net emigration in 2017 was therefore 449 persons, markedly higher than the average annual net emigration since 1993.
Figure 3. Migrations 1993 - 2017
Source: Statistics Greenland, http://bank.stat.gl/beebbiu2
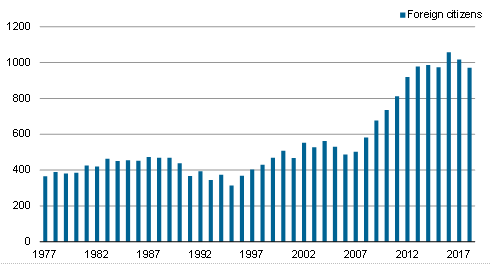
Figure 4. Foreign citizens 1977-2018
Source: Statistics Greenland, http://bank.stat.gl/beest6
Summary table 3. Foreign citizens 2012-2018
Source: Statistics Greenland, http://bank.stat.gl/beest6
The number of foreign citizens has been declining for the past couple of years. In total there now live 970 foreign citizens in the country. From the table in our StatBank it can be found that especially Icelandic citizens have left Greenland (from 204 persons in 2016 to 127 this year). Philippine citizens now counts 215 (22.2 pct) of foreigners in Greenland.
Based on a preliminary calculation of the number of live births and deaths in 2017 shows the key figures for population trends in 2017 ( summary table 4)
Summary table 4. Population Account 2017
|
Population January 1st 2017 |
55.860 |
|
+ number of liveborn (provisional) |
859 |
|
- number of death (provisional) |
499 |
|
+ immigrants |
2.287 |
|
- emigrants |
2.736 |
|
- Corrections (provisional) |
-106 |
|
Population Januar 1st 2018 |
55.877 |
Source: Statistics Greenland, http://bank.stat.gl/beecalc
Detailed tables can be found in our Statbank (http://bank.stat.gl)